The goal of stock investment is to buy a stock and sell it at a higher price. To do this, investors seek to predict future stock movements. Predicting the future is notoriously difficult, but investors have come up with systems designed to anticipate future stock movements and choose stocks to buy.
Two Ways to Predict Stock Returns
These systems fall into two broad categories:
- Fundamental analysis looks at the stock as part of a business and it assumes that the stock will perform according to the strength or weakness of the business. Fundamental analysts study a company’s financial figures, business plans, management, and other factors affecting the performance of the business. They also devote effort to studying and understanding the industry and the competitive environment.
- Technical analysis relies on a detailed examination of past trading patterns to anticipate future moves. Technical analysts study charts – often very complex charts – and apply various systems to deduce trading patterns that allow them to anticipate future movements.
Each of these systems has strengths and weaknesses, and each can help investors make decisions. Fundamental vs technical analysis is a topic investors can argue over for hours. We’re not taking sides, but we will try ti explain the basics of the two methods and how they are used.
The Case for Fundamental Analysis
The argument for fundamental analysis is simple. A stock price reflects the value of the company. It may deviate from that value at times, but it will return to a point that reflects the company’s value. If this company is growing and increasing its revenues and earnings, the stock should go up in value. If the company goes bust, so does the stock.
This logic sounds compelling and frankly, I think it is. Ignoring fundamentals can be dangerous. If your only way to make a profit relies on other people’s opinions about the stocks, you might buy into a hype-driven bubble completely unaware.
Unprofitable or rubbish companies have been known to see their stock going up on speculative activities, before crashing to their real value, zero.
So fundamental analysis seemingly provides a safer, more cautious, calculated, and long-term approach to investing.
Where it gets complicated is how to use fundamentals to value a company.
Should you base your calculations on future cash flow? Earnings? The value of currently owned assets? How much do the expectations of future growth enter into account? What price tag to put on management quality or company culture? Are some industries or sectors inherently worth more than others? How do you price R&D and innovation?
There isn’t and will never be a consensus on these questions. This is why different investors can’t agree and try to outsmart each other constantly. For every buyer acquiring a stock that seems undervalued, there is a seller who believes it’s time to exit. Only time will tell who’s right.
Fundamental analysis is the first choice of long-term buy-and-hold investors. Stocks in quality companies may move up or down as market moods fluctuate, but the basic premise of fundamental analysis is that strong companies in strong industries will grow in value.
The Case for Technical Analysis
Technical analysis is designed more for trading than for long-term investing. If you buy and sell a stock in just a few days or weeks, the performance of the underlying business is mostly irrelevant. The short-term opinions of “the market” are all that matter.
Technical analysts may not even know what a company sells. Their priority is analyzing the market’s perceptions of a stock, usually by studying charts showing a stock’s price movements and trading volume.
Technical analysis can very quickly rely on a lot of jargon and unique terminology. So it can simultaneously sound very obscure and very scientific to the un-initiated. For example, a look at the 5 years chart for Apple.
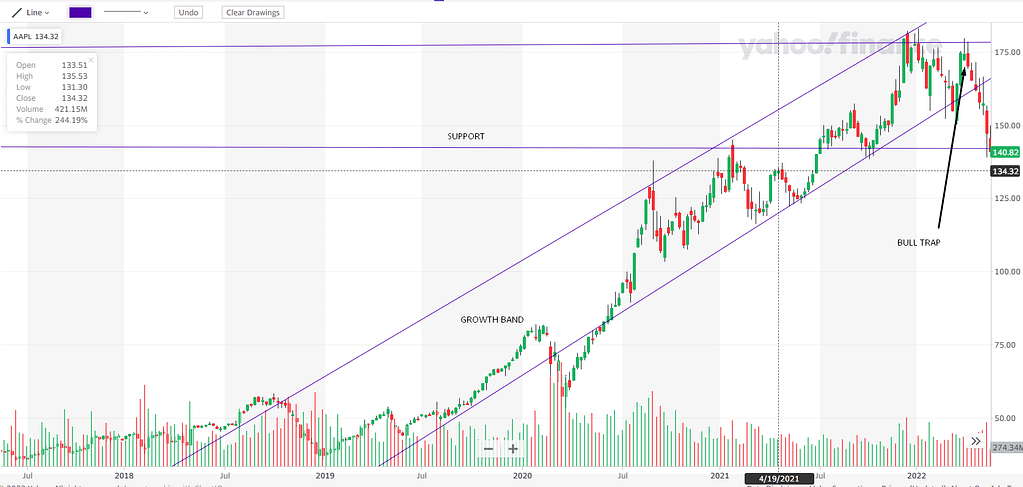
A technical analyst might say that “Apple was in an upward band since 2019, but broke its lower range in 2022. It is now testing the support level of 140“. What this means with less jargon is that for a while, Apple stock price was going upward steadily, before recently going down.
Technical analysts typically use detailed charts displaying high, low, open, and closing prices for each day, along with trading volume. When prices drop, they look for a “support level”, which is the price that begins to draw new buying in. When prices rise they look for “resistance levels”, the point at which traders begin to sell and the price rise stalls.
Technical analysts use hundreds of analytical tools, racing from Accumulation/Distribution to ZigZag. For example, here’s an Apple chart displaying Bollinger Bands and the Chaunde Momentum Oscillator.
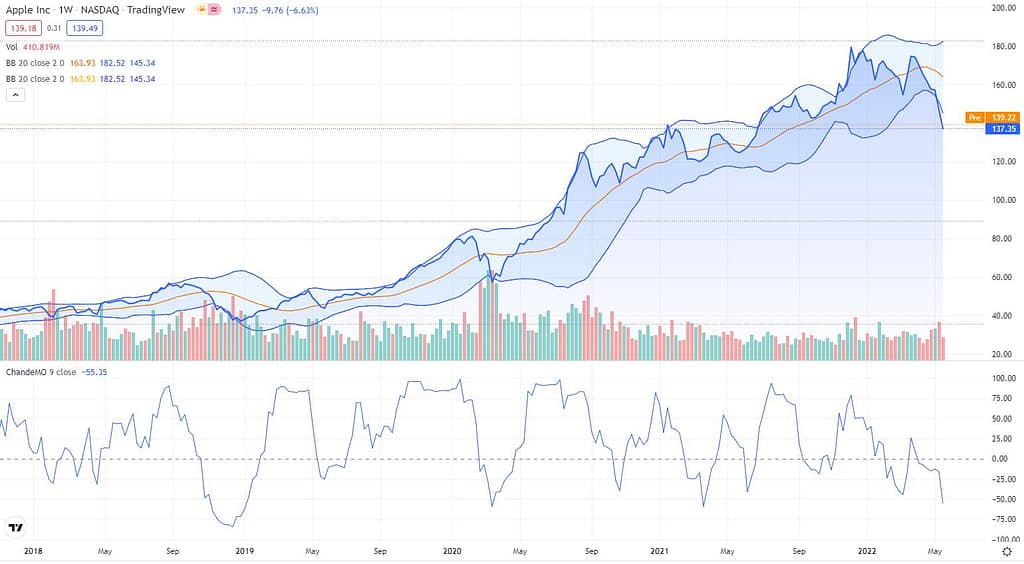
If you don’t fully understand that, don’t worry. Most people don’t. It’s just an example of the types of charts that technical analysts use.
Technical indicators fall into four rough brackets:
- Trend indicators measure the strength, direction, momentum, and changes of price trends.
- Momentum indicators identify how fast prices are changing.
- Volatility indicators measure the rate of price movements, regardless of direction.
- Volume indicators look at patterns in trading volumes.
Technical analysts combine these tools in complex mathematical models that they believe will predict upcoming price movements.
There are two reasons why it can make sense for investors to pay attention to technical analysis and put the effort to learn how to do it properly.
- The first is the theory that the stock price reflects a sort of wisdom of the crowd (efficient market theory) and includes de facto all the information you need to know about the stock. In that context, studying the price movements would tell you about the stock prospect as much as knowing the company. Also, mathematical tools help investors take distance from the stock and control their emotions.
- The second reason is that a LOT of investors, especially large funds and banks rely on technical analysis for their trading and the programming of the trading “bots”. So if they start to sell aggressively when the price goes below a “support level”, this can easily turn into a self-fulfilling prophecy.
The problem with technical analysis is that it is very subjective. When the stock price hit 3 times a lower mark and rebounds right after, it is a sign of strong support building up at this price? Or a sign that the stock will break lower any time soon. Depending on how you interpret other patterns, both interpretations can be valid.
Technical analysis also cannot predict or consider the impact of external events. It’s based entirely on past patterns, and the future is by nature unpredictable.
So technical analysis can be far from the scientific and objective science it claims to be, and be very sensitive to bias and opinions.
What to Use?
The debate over fundamental vs technical analysis can be polarizing. It is common to see investors swear by only one of the 2 methods. The fundamental analyst thinks technical analysis is mumbo jumbo and just drawing whatever lines fit the result you want to demonstrate. And technical analysts like to point out that the countless fundamental analysis methods often contradict each other.
I think both methods have the same weaknesses. They try to give a 100% certain answer from an imperfect data set. Cash flow statements do not represent a well competitive advantage, future of an industry, or macroeconomic risks. But neither does a stock price chart.
So I suspect multiple methods of analysis in parallel are preferable, including mixing different fundamental and technical analysis methods. Investing is in many ways more an art than a science, and there’s a place for multiple methods.
Some investors take a combined approach, using fundamental analysis to decide what stocks to buy and technical analysis to decide when to buy or sell them. This approach can help identify optimal and entry points once an investor has identified fundamentally appealing stocks.
Conclusion
So who wins the fundamental vs technical analysis debate? I think both methods can be part of the toolbox of investors, and both should be looked at with a healthy dose of skepticism and humility. A precise DCF (Discounted Cash Flow) model can be as flawed as a technical analysis ignoring fundamentals.
I would also suspect that when both approaches agree, it can be an interesting sign it’s time to act. Combined with other methods, like behavioral investing and macroeconomics, both fundamental and technical analyses can help investors improve their performance as long as they do not follow any single model blindly.
The post Fundamental vs Technical Analysis appeared first on FinMasters.
FinMasters