Instagram Stories is all fun and games and effortless swipes – that is when you’re using the feature on your personal account. But when you make Stories a part of your marketing strategy and dive knee-deep into it, well, you find that all the unique benefits the channel offers don’t come without hard work on your part. Instagram’s data shows that 33% of the most viewed Stories come from businesses. And rest assured, there’s quite a bit of strategy standing behind those engaging and seemingly effortless creations. All of them are trying to reduce bounce rate, and they are all doing it in a different way.
It all starts with actually managing to maintain a tight grasp on the viewer’s attention. Sure, each snippet takes only a couple of seconds. But in a landscape of 400 million daily active users and short attention spans, a lot can happen (or fail to happen) within this time frame. After all, it takes a single tap for the viewer to exit your Stories for good.
In this post, we’ll go over the metrics you need to track if you want to reduce bounce rate. We’ll also take a look at some actionable tips to make your Stories perform better.
Understand these key metrics to reduce bounce rate
Reach and impressions
Reach represents the number of users that have seen your Story. The Impressions metric tells you how many times a Story has been viewed.
For example, if 1 person views your story 5 times, that will make for 1 reach and 5 impressions. Your best Stories will have the highest impressions rate, so track those to see what’s working best with your audience.
How to determine and reduce your bounce rate for Instagram Stories #InstagramMarketing
Click To Tweet
This is likely to happen if you’re pushing out one Story after another in a short time period. At some point, it simply becomes too much for people to engage with.
But it will also happen if your Stories aren’t a good fit for your audience. Make sure to go over your content strategy once again. The Stories might be too promotional, not relatable, or too generic for your follower base.
Exits and Next Story
These two metrics go hand in hand with a declining reach. They indicate the number of users who have left your Story before completing it, but the distinction between them is very important.
Instagram Insights labels an exit when the user swipes out of the entire Stories feature while viewing your Story. So it refers to three actions:
- exiting the entire Instagram app
- going back to the main feed
- exiting Stories to return to your profile
What this means is that sometimes, high exit numbers may be just what you were asking for.
For example, let’s say you announce in your Story that a new post is up on your feed and invite your audience to check it out. In this case, a high number of exits will indicate that they went ahead and did what you had asked for.
The metric labeled as “Next Story”, however, has a much more negative connotation. It indicates the number of users who swiped away from your Stories to move on to the next account’s Story. They’re still there, using the feature, only they’re no longer interested in you. That’s why this is probably the most important metric to track when you’re trying to reduce bounce rate.
If you roll out a sequence of Stories and see one with a particularly high number of Nexts or Exits (which means the Story after that one will have a significantly lower reach), you can usually pinpoint that one as the glitch in your strategy. These metrics are not only helpful for indicating which type of content isn’t performing well so you can reduce bounce rate. They will also help you figure out what’s the optimal number of slides in a sequence before people stop paying attention.
Taps forward
This metric shows how many users have tapped to move on to your next Story before the previous one finished. Although the viewer has remained in your Stories sequence, a tap forward indicates they’re rushing through your content. Naturally, it can give you some insight to help reduce bounce rate. So if you’re seeing a rather high number of taps forward, first check if your Story is too long.
Secondly, observe which type of content gets the most taps forward. When it comes to video, a high number of taps forward indicates that your content isn’t interesting enough. But with photos, it’s a far less tragic metric because many people just throw a glance and speed through.
Taps back, however, show that users were intrigued enough by your previous Story to return to it once again. Now, that’s the type of Story you want to focus on in your strategy to reduce bounce rates. You’re definitely doing something right there!
Get to know your target audience better
We’ve talked in this post about how dangerously declining reach numbers point to your content strategy not being well-aligned with your target audience.
Understanding your audience is the key to reducing bounce rate on your Instagram Stories
Click To Tweet
Otherwise, if you’ve already set strong foundations and don’t need a major strategy upgrade, you can rely on social listening tools to gain a better understanding of your audience and craft content that resonates well with them. The work never stops here – you need to always be tuned in and keep a watchful eye. Additionally, tracking these metrics will help you gain more insight and run comparisons.
Conduct polls
Why not ask your audience exactly what type of content they’d like to see from you? There’s a simple and straightforward solution. Use the Interactive Polls feature to ask your followers to choose between two options – for example, whether they would like to see more live Q&A sessions with you or more takeovers in your Stories. Polls are engaging and asking your audience for their opinion will give you actionable insights. But that’s not all. It will also help strengthen your relationship and make them feel personally invested in your brand.
Tell a story from beginning to end
Rather than posting random Stories that have nothing to do with each other and hoping that each one will do fine on its own, you can pull your audience in with a sort of “visual essay”. Do what the feature literally suggests – tell a story. Follow it through from beginning to end using still images, text-only snippets, boomerangs, and videos. This is great for showing the behind-the-scenes of your business, to take your audience along to an event, or to show your products in action.
Anything works, really – you just want to create a coherent slideshow, where each slide anticipates the next one. Crafting these types of stories will also help you figure out which type of media performs best with your audience by tracking the taps forward and exit metrics.
Design Milk, a platform dedicated to modern design, does a great job with visual storytelling in their Tour and Event Stories. Taking the audience along with them to workshops, showrooms, and design events, they strive to paint a picture of their surroundings and the objects they encounter through different mediums.

Mind the composition
If you’re seeing a lot of taps forward, the reason behind this unflattering metric could be absolutely mundane. Be careful where you place your relevant hashtags, @mentions, and CTA’s – if they’re too close to the right side of the screen, you’ll be getting a lot of unintentional taps forward. It sounds ridiculous but I’ve seen so many Stories with the clickable stickers posted in this exact awkward manner. And considering the nature of this platform, you can’t place your bets on viewers returning to your content. Once they’ve been pulled away, even if it’s unintentionally, they’re gone. Not to mention the frustration factor.
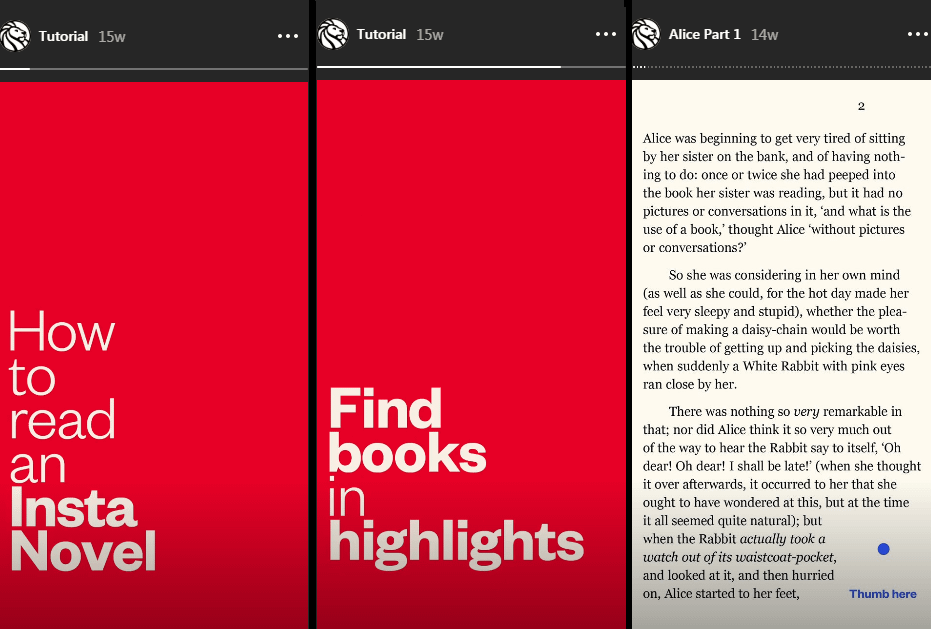
For a positive (and rather charming) example, we can turn to the official Instagram account of the New York Public Library. In their marvelous “Insta novel” project, they’ve presented the audience with entire books through Stories. In order to complete reading each slide, a viewer has to hold their thumb on the screen to hold the Story. Each page is designed with the “thumb space” clearly indicated at the bottom of the screen, where it is least obtrusive. It’s a simple and hence obvious solution that shows great care for adjusting Stories to the user behavior.
Final words
If you haven’t yet made the switch to a business profile on Instagram, having access to these key performance indicators should be a compelling reason to do so. By understanding what these metrics represent and how they can be interpreted, you’ll have valuable insights that to help you test what kind of content works best and unlock the true potential of Stories.
Instagram’s business features allow you to better understand your audience so you can #ReduceBounceRate
Click To Tweet
The post How to Reduce Bounce Rate for Your Instagram Stories appeared first on Revive Social.