Want to grow your Instagram account? The key is understanding your Instagram analytics – and knowing which metrics you need to understand and regularly track.
Instagram’s popularity has led to a deluge of information about what brands should be doing on Instagram. Should you follow and unfollow? Use precisely 30 hashtags for every post? Post once a day or 22 times a day? Give IGTV a go?
Trying to build an Instagram strategy that works for your brand can quickly get overwhelming.
What is the secret to building a successful Instagram strategy? Understanding that every niche and every business is different. So, posting at 5 a.m. might work for one account, while posting at 2 p.m. might work for another. Using 30 hashtags might work for one brand, and it might not work for another.
But here’s the thing: best practices for Instagram only tell you what works best for most accounts, not what will work best for your account. This is why it is so important to make sure you are tracking Instagram analytics metrics.
Tracking a variety of Instagram analytics metrics will show you what works best for your specific account.
Why are Instagram analytics metrics so important?
The Pareto Principle (aka the 80/20 rule), coined by management consultant Joseph M. Juran, suggests that 80% of effects come from 20% of causes. In layman’s terms, this means that 80% of the results you see on your Instagram account come from just 20% of your efforts.
Instagram analytics metrics allow you to see which 20% of your efforts are actually working, so you can focus more on what get results and stop wasting time on efforts that do little to nothing, especially when you’re running Instagram promotions.
What are Instagram analytics?
Instagram analytics tell you how your posts, stories, and Instagram account overall are performing. There are dozens of types of Instagram analytics, and the ones you will want to track will depend upon your goals, audience, and strategy.
Below, I’ve outlined the top 10 Instagram analytics metrics you should be monitoring.
For each metric, I’ll walk you through why they matter, what they tell you, and how to find or calculate the data. Some metrics are easily accessible in Instagram Insights, while others require a bit more work.
1. Story completion rate
Instagram Stories expire after 24 hours and show up at the top of the Instagram feed, making them one of the most engaging features on Instagram. But, how can you tell if your Stories are resonating with your audience?
One metric to look at is your story completion rate.
What your story completion rate tells you
Your story completion rate tells you how many people looked at all of the posts in your story, and did not swipe to go to the next story, close Instagram entirely, or go back to their main feed.
Unfortunately, Instagram doesn’t actually tell you your Instagram Story Completion Rate so you will have to do a little digging.
How to find your story completion rate
Instagram does give you your exit rate, which allows you to reverse engineer your Story Completion Rate. To find your exit rate, go to Instagram Profile > Hamburger Menu (upper right corner) > Insights > Content > Stories. Now, select the story you want to see insights on. You will be able to view impressions, reach, taps back, taps forward, replies, swipe away, and exits.
Here is how to calculate your Story Completion rate:
Reach – (Swipe Away + Exits) = Story Completion Rate
Adding the number of people who swipe away and exit gives you a clearer picture of which stories are actually resonating with your audience, so you can focus more of your efforts on what works.
2. Branded hashtags mentions
Branded hashtags are created to track brand mentions and often used to encourage user-generated content.
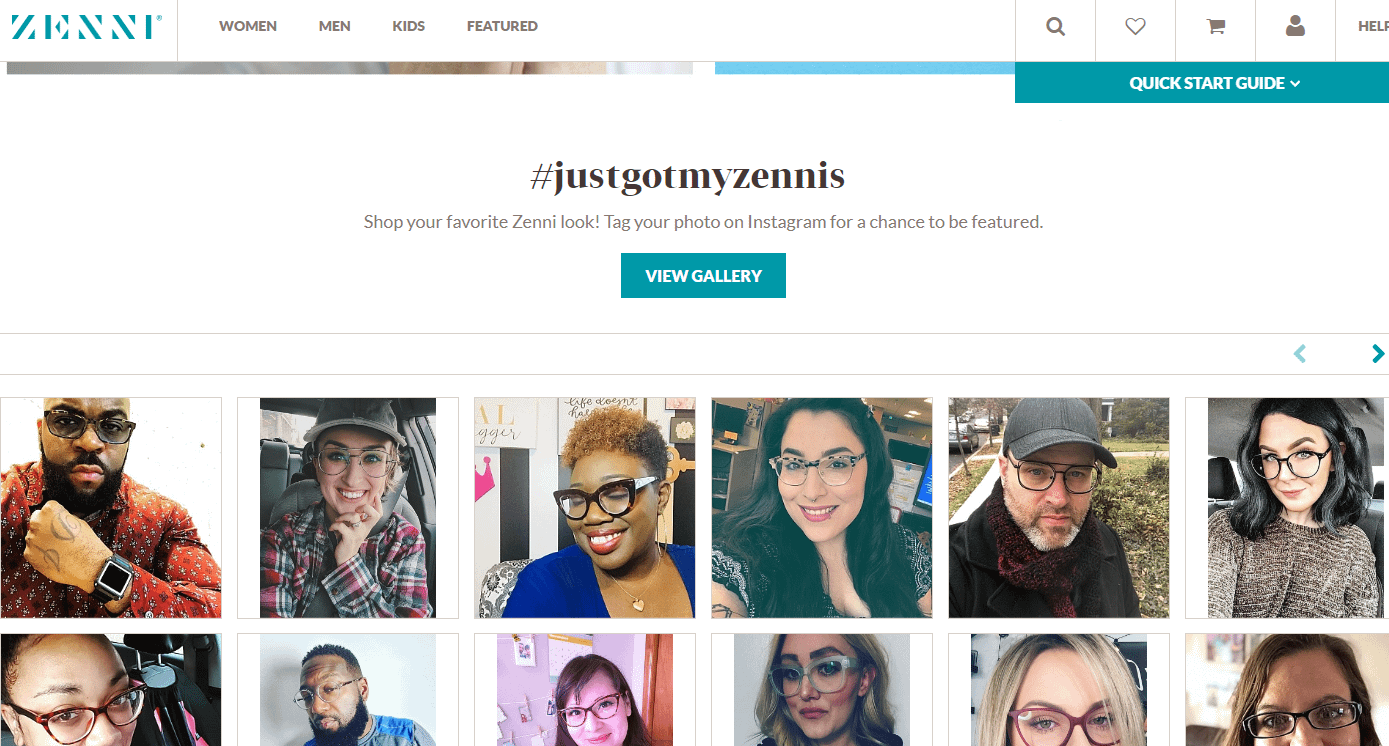
For example, online eyeglass retailer Zenni encourages its customers to share pictures of themselves wearing their new glasses with the hashtag #justgotmyzennis.
What branded hashtags uses tell you:
Branded hashtag uses tell you if your efforts to drive user-generated content are working, and also gives you insight into how your customers view your brand as a whole.
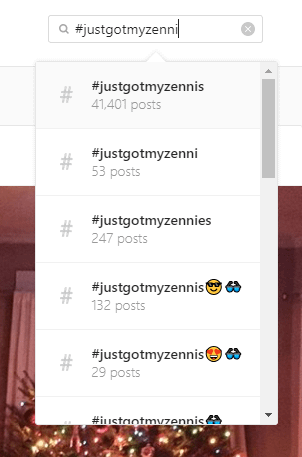
Make sure to check for variations of your hashtag, including #yourbrandname. As you can see below, the Zenni hashtag also has a few variations.
Where to find hashtag mentions
You can track this manually. Simply type the hashtag into Instagram and see how many posts there are using your hashtag. Note the number so you can compare how hashtag uses grow over time. Track this number on a regular basis so you can monitor growth.
3. Website Click-Through Rate
Most brands can only share one link on Instagram – the website link in their Instagram profile. (Unless, of course, you have over 10,000 followers or a verified account and can add links to your Instagram stories.)
That one link is pretty important. Tracking how often it gets clicked gives you an insight into the overall performance of your Instagram account.
What website CTR tells you
This Instagram analytics metric tells you how many times an Instagram user clicks on the website link in your Instagram profile. Pretty self-explanatory.
Tracking clicks long term will give you insight into the overall health of your account. It should be tracked in conjunction with more granular insights, such as engagement rate and follower growth.
How to track your website CTR::
This one is super easy. Go to Instagram Profile > Hamburger Menu (right corner) > Insights > Actions. Just scroll down a bit to see your website clicks.
4. Discovery
Discovery is a set of Instagram analytics metrics that track the total reach and impressions of your content.
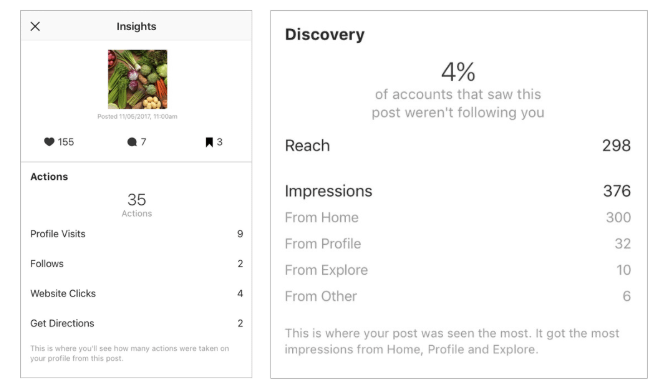
Reach tells you the number of unique accounts that have seen your posts. Impressions are the total number of times all your posts have been seen.
What discovery tells you
This Instagram analytic metric will show you what days your posts are seen the most, where they are seen the most, and whether that information has increased or decreased over the previous week. You can also see if your posts were seen by a large number of accounts that aren’t following you.
This will tell you if your posts were found by non-followers through a search, versus showing up in the feed of someone who follows you. This can help you tell, for example, if a new hashtag you are using is resulting in more non-followers seeing your posts.
How to track discovery
Open Instagram then go to Profile (profile photo in the bottom right corner of your Instagram feed) > Hamburger menu in upper right corner > Insights.
Discovery will be the second section on the front tab of your Insights.
5. Instagram follower growth
Your Instagram follower growth is more than looking at the number of followers you have. Just looking at how many followers you have doesn’t give you the whole story, but tracking how those numbers change over time does.
What Instagram follower growth tells you
Paying attention to how your followers grow gives you quite a bit of insight into the overall health of your Instagram account and the success of specific Instagram initiatives. For example, if you see a higher-than-average uptick in followers after running an ad or using a specific hashtag, then you have a good idea that your initiative worked.
How to find follower growth
To get the most out of this Instagram analytics metric, you will need to track it over time. Unless you are using an Instagram analytics tracking tool, you will need to do this manually.
At a minimum, once a week you should check your follower numbers and note them (preferably in a spreadsheet). If you plan a new initiative, check your numbers both before and after the launch to see if there has been a change.
6. Instagram engagement rate per follower
This is one of the most important Instagram analytics metrics you should track because Instagram rewards high engagement rates by showing more of your content.
What engagement rate tells you
This Instagram analytics metric will tell you how your audience is responding to your posts. Are they liking, commenting, or saving your posts?
How to track Instagram engagement rate
You can track your overall Instagram engagement rate manually. Here is how to calculate it.
(Likes + Comments) / Number of Followers * 100 = Engagement rate
Add together the number of likes and comments, then divide by the number of followers. Now, multiply that number by 100 to get a percentage.
7. Engagement per post
Once you calculate your engagement per follower, you might want to dig a bit deeper to figure out what level of engagement you can expect for each post.
What engagement per post will tell you
The Instagram analytic metric will tell you if a specific post is doing better or worse than average. You can calculate this over a specific time period, or over the life of your account. In most cases, you will want to use a specific time period, for example, a week or a year. Then you can see if new posts are driving more engagement.
How to track engagement per post
It is similar to tracking engagement per follower, except you use the number of posts instead of the number of followers. Here is the formula.
(Likes + Comments) / Number of Posts = Engagement Per Post
Here is what it will look like in action, calculating for the past week.
(250 likes + 100 comments in the last week) = 350
350/25 ← (number of posts in the last week) = 14
The average post in the last week received 14 likes or comments per post. Now you have a starting point to see if posts are getting more or less than average engagement. Pay attention to posts that do better than average so you can increase that type of content.
8. Instagram Live viewers
Instagram Live is a feature that allows you to share a live streaming video to Instagram. Followers can like or comment in real time and after the live stream, you can choose to save and share the video to your stories.
What Instagram Live viewers will tell you
This Instagram analytic metric will tell you how many people watched your video. Unfortunately, Instagram doesn’t offer more detailed analysis for live videos. But, knowing how many people view your live video does give you an idea of whether or not your video reached your audience.
How to track Instagram Live viewers
You will need to track this information manually, as the video metrics disappear once it expires from your Stories. To view this metric, review your own video replay, and you will see the total number of views in the bottom left-hand corner.
9. What time your followers are online
There is a ton of information online about the best time to post on Instagram. But, instead of following best practices, take a look at your own data first!
What this Instagram analytics metric will tell you
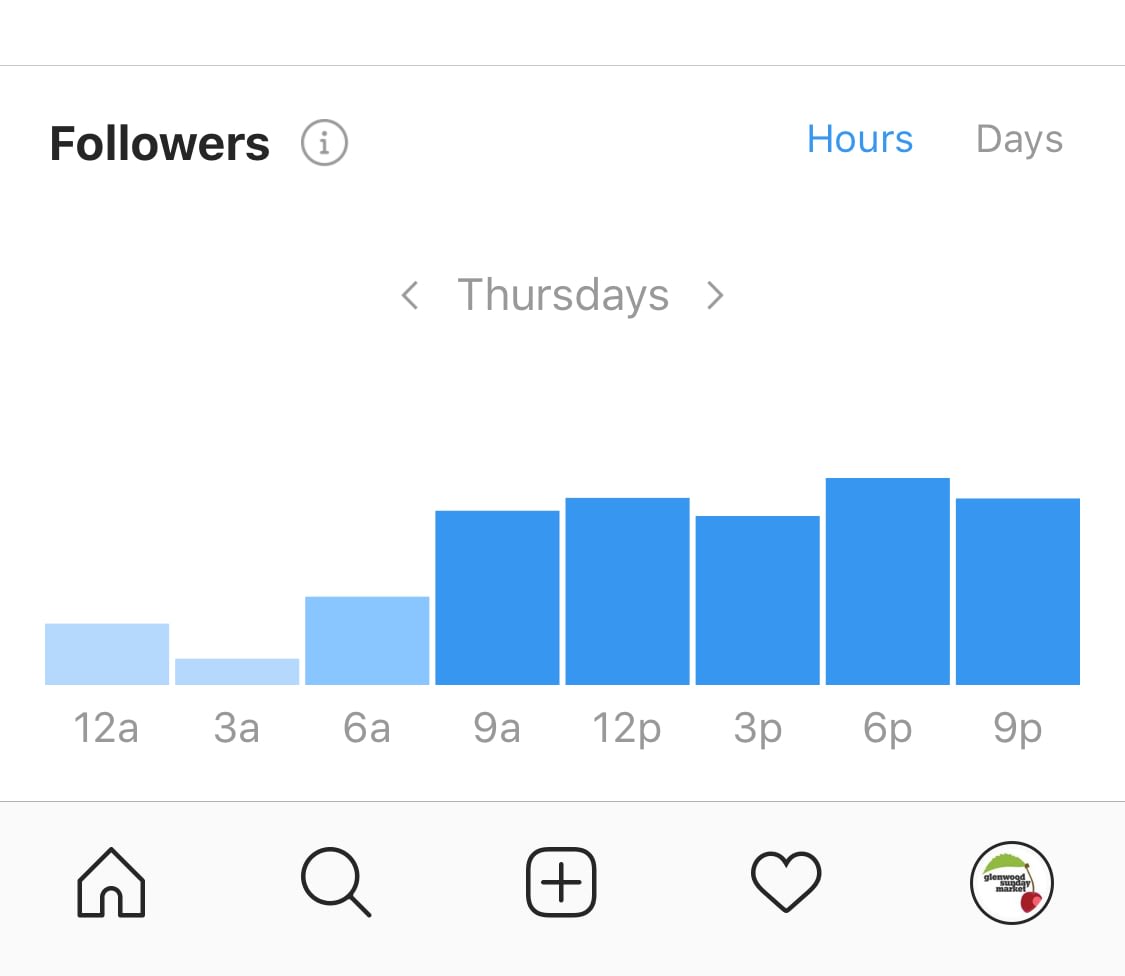
Knowing when your followers are online is critical to figuring out when to post on Instagram. You can read about ‘the best times to post’ all day long, but the truth is, you need to post when your audience is online.
Luckily, this is one of the easiest Instagram analytics metrics to find.
How to track what time your followers are online
Open Instagram, then go to Profile > Hamburger Icon > Insights > Audience.
10. Top performing Instagram posts
To really understand what is working on your Instagram account, you need to look at which posts are performing the best.
What your top performing posts will tell you
This Instagram analytics metric will give you insight into what works, though you may need to drill down to determine what part of the post made it successful. For example, it might have been the time you posted, the topic, or a hashtag you used.
How to track your top performing posts
Instagram makes it super easy to see what posts have been the most popular, and they even let you sort posts based on what you think makes a post successful.
Here is how to view this Instagram analytics metric:
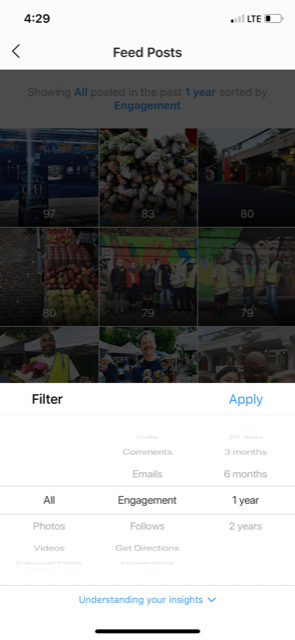
Open Instagram, then click to Your Profile > Hamburger Menu > Insights > Content > See All (next to Feed Posts)
Instagram will automatically sort your posts in order of engagement over the past year, but you can use the filters to view based on Follows, Comments, etc. You can also change the time frame and sort by the type of content.
Final thoughts on Instagram analytics metrics
You might also like to use an app or tool to track your metrics. For more, check out our guide to the 7 Best Instagram Analytics Tools.
To measure success on #Instagram, you must track the metrics relevant to your #SocialMediaMarketing goals
Click To Tweet
The metrics we’ve explored in this article will give you a high-level view of what is – and what is not – working for your Instagram account. Over time, you will be able to use this data to build a stronger, more effective Instagram strategy.
The post Instagram Analytics: A Beginner’s Guide appeared first on Revive Social.