Facebook needs no introduction, given that most of the globe currently has an account. As a marketer, you know this, which is why you likely put plenty of effort into using Facebook to generate leads and maximize revenue.
In this article, we’ll break down the 20+ Facebook marketing statistics you need to know as a marketer in 2020, so you can get the most out of the social media platform.
Let’s talk numbers!
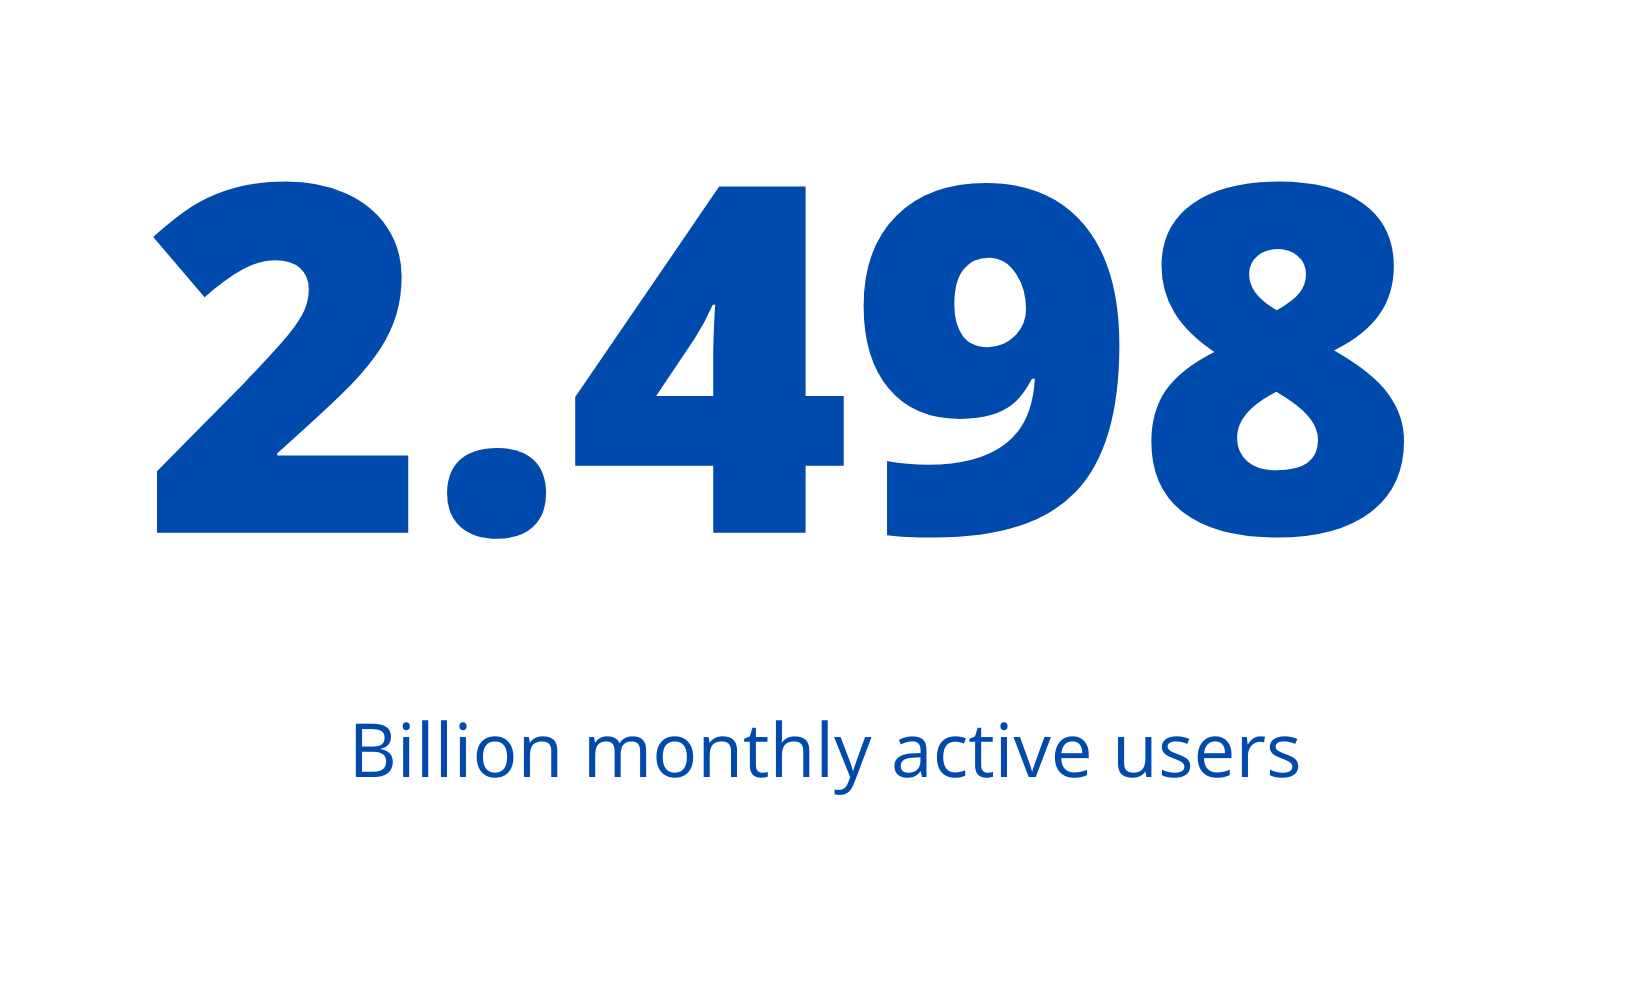
1. Facebook boasts over 2.498 billion monthly active users


Not all of these users will fall within your potential audience, but Facebook is by far the most ‘active’ social media platform on the market. The closest networks on its heels are YouTube and WhatsApp, with about two billion active users per month each.
2. Over half of Facebook daily active users are on mobile devices
Facebook boasts around 1.66 billion daily users – and one billion of them interact with the platform using mobile devices. In a nutshell, this means your content should be heavily optimized towards mobile audiences.
3. Facebook ad prices decreased by 6% on average in 2019
By the end of Q4 2019, Facebook had seen a decline of over 9% on average (PDF) in ad prices. The company attributed this to marketers shifting towards using Stories to reach audiences, as well as an increased focus on less competitive markets.
If you want to follow this trend, we’ll dig into some numbers further on that discuss Stories and how you can leverage them.
4. The average Click-Through Rate (CTR) for Facebook ads is 0.9%
The most popular industries (retail and legal) yield CTRs of up to 1.59–1.61% on average. At the other end of the spectrum, you have low-performing areas such as employment and job training ads, and home improvement offers.
If you’ve been panicking because you think your CTR is too low, start by looking at how it compares to the average for your industry. Unless your numbers are decidedly lower, you may want to look into other areas of improvement before this one.
5. The average Cost-Per-Click (CPC) for Facebook ads is $1.72
To give you a comparison point, the CPC for Google ads across the entire search network is $2.69 on average. When it comes to CPC, finance and customer service industries take the lead, with average costs of over $3.
If your CPC costs look too high, the best way to reduce them is to ensure you’re targeting a more narrow audience with relevant ads. If you can find overlaps between your target audiences, even better.
6. Facebook ads boast a 9.21% conversion rate on average
One thing Facebook has in favor is some of the highest conversion rates on the web. Some industries in particular (such as fitness) boast conversion rates of over 14%, which is unheard of. If you want to analyze visitor behavior to find out why they’re not converting, analytics tools such as heatmaps are a great start.
7. About 11% of Facebook posts are now in video format
It should hardly come as a surprise that video is gaining ground quickly among Facebook users. Facebook videos get over four billion views a per day, which offers a fantastic opportunity for engaging your audience.
Of course, creating engaging videos is of the utmost importance, much like any other aspect of social media content creation.
8. Videos get a lot more interactions than images or text posts
Based on the Facebook marketing statistics we have access to, videos get 38% more engagement than image posts. When you compare videos to text posts, the engagement gap rises up to 72%. This doesn’t mean you should focus on video only, but given the bigger engagement rates, you stand to gain a lot by putting greater emphasis on the format.
9. Only 4.6% of Facebook marketers use Stories ads
If you had any doubts about how big an opportunity Stories ads represent, this figure should quench them. Despite their high engagement rate, only 4.6% of Facebook marketers are putting their money into Stories ads. This means every dollar you spend here can yield a significantly higher return since the competition is lower.
Your results may vary depending on what industry you’re advertising in, but shifting at least part of your budget towards Stories is definitely a smart move.
10. 85% of Facebook videos get muted
One of the most curious statistics surrounding Facebook concerns videos. Most of the people that watch them do so without sound, which means adding captions to your videos can help you make them more user-friendly.
11. ‘Young’ users pay less attention to videos
On top of muting videos, users aged 18-24 are the most likely to skip them altogether. According to the numbers, video engagement rises the older users get (and the more patient they become). In other words, although video offers a fantastic marketing opportunity, you need to keep in mind that young audiences get easily distracted.
If you want to target the this demographic with video, try to keep your ads below the 21-second mark. Videos under two minutes long get the most engagement, but the 21-second window is critical if you want to get as many full views as possible.
12. Live streams get up to 4x more viewers than traditional videos
If you have a big announcement to make, the best way to do it is through a live stream. According to the Facebook marketing statistics, live streams get up to four times the views that traditional videos do. The smart approach is to use a combination of both live streams and video as part of your marketing strategy.
13. Popular pages tend to post around 100 times per month
On average, pages with 100,000 to one million followers publish around 100 posts per month. Once you climb up to the 10 million follower range, the rate of publication doubles.
Overall, these Facebook marketing statistics show a clear correlation between how much content you post, and how many people you can reach. Keeping up the rate of content and ad production can be time-intensive, though. Given this, you’ll want to take advantage of various social media management tools.
14. Male users between 25-34 are Facebook’s biggest demographic
Users within this demographic make up 19% of Facebook’s audience, whereas their female counterparts within the same age range make up for 10%. On average, male users between the ages of 18 and 44 outnumber female users. However, for older demographics (45 to 64+ years) the percentage of users is roughly the same for both sexes.
Keep in mind that Facebook is not the only game in town when it comes to social media marketing. Chances are at least part of your target demographic uses it, but you’ll want to focus on whichever platform your audience spends most of their time on.
15. Users spend an average of 38 minutes per day on Facebook
On average, Facebook users spend around ten more minutes on the platform per day than their Instagram counterparts. However, projections say that in 2021 average daily time-on-site for Facebook will hold steady, although the number will rise for Instagram.
16. India is the country with the most Facebook users
Given the population size, it may not surprise you to hear that India is by far the biggest source for Facebook users. The country boasts over 280 million Facebook users, with the United States coming in second at 190 million.
When you consider the US ‘only’ has 328 million citizens, though, compared to India’s nearly 1.5 billion, you can see the adoption rate is much higher for the former.
17. The number of Facebook users in the US will hold steady in the short term
Projections show the number of US Facebook accounts probably won’t rise dramatically within the next few years (up to 2023,) with a projected cap of around 223 million. In practice, Facebook is already probably close to market saturation in the US.
However, Americans are first in the world when it comes to online expenditure (with the UK right behind), so they make for a perfect target audience.
18. 43% of marketers don’t know if their investment in Facebook is paying off
When you consider that about 93% of marketers use Facebook, the number we’ve presented intimates half of them have no idea how to measure the impact of their efforts.
As such, if you’re not doing so yet, you need to start using analytics tools to measure conversions and track user behavior. Without the data in pocket, you’re spending money blindly.
19. Over 78% of US consumers have purchased items recommended on Facebook
If you’re targeting a US audience, you’ll be happy to know a vast majority of them aren’t scared to purchase goods or services they find through Facebook. This should come as no surprise, though, considering the high conversion rate of Facebook ads.
20. Facebook Stories get over 500 million daily views
Those 500+ million daily views actually compete with Instagram’s own metrics for stories. That’s a surprising number, considering Instagram is known as the platform for stories.
Earlier, we talked about how this trend played a role in diminishing ad prices within the platform. For you, this means Stories might offer more organic marketing opportunities than other approaches.
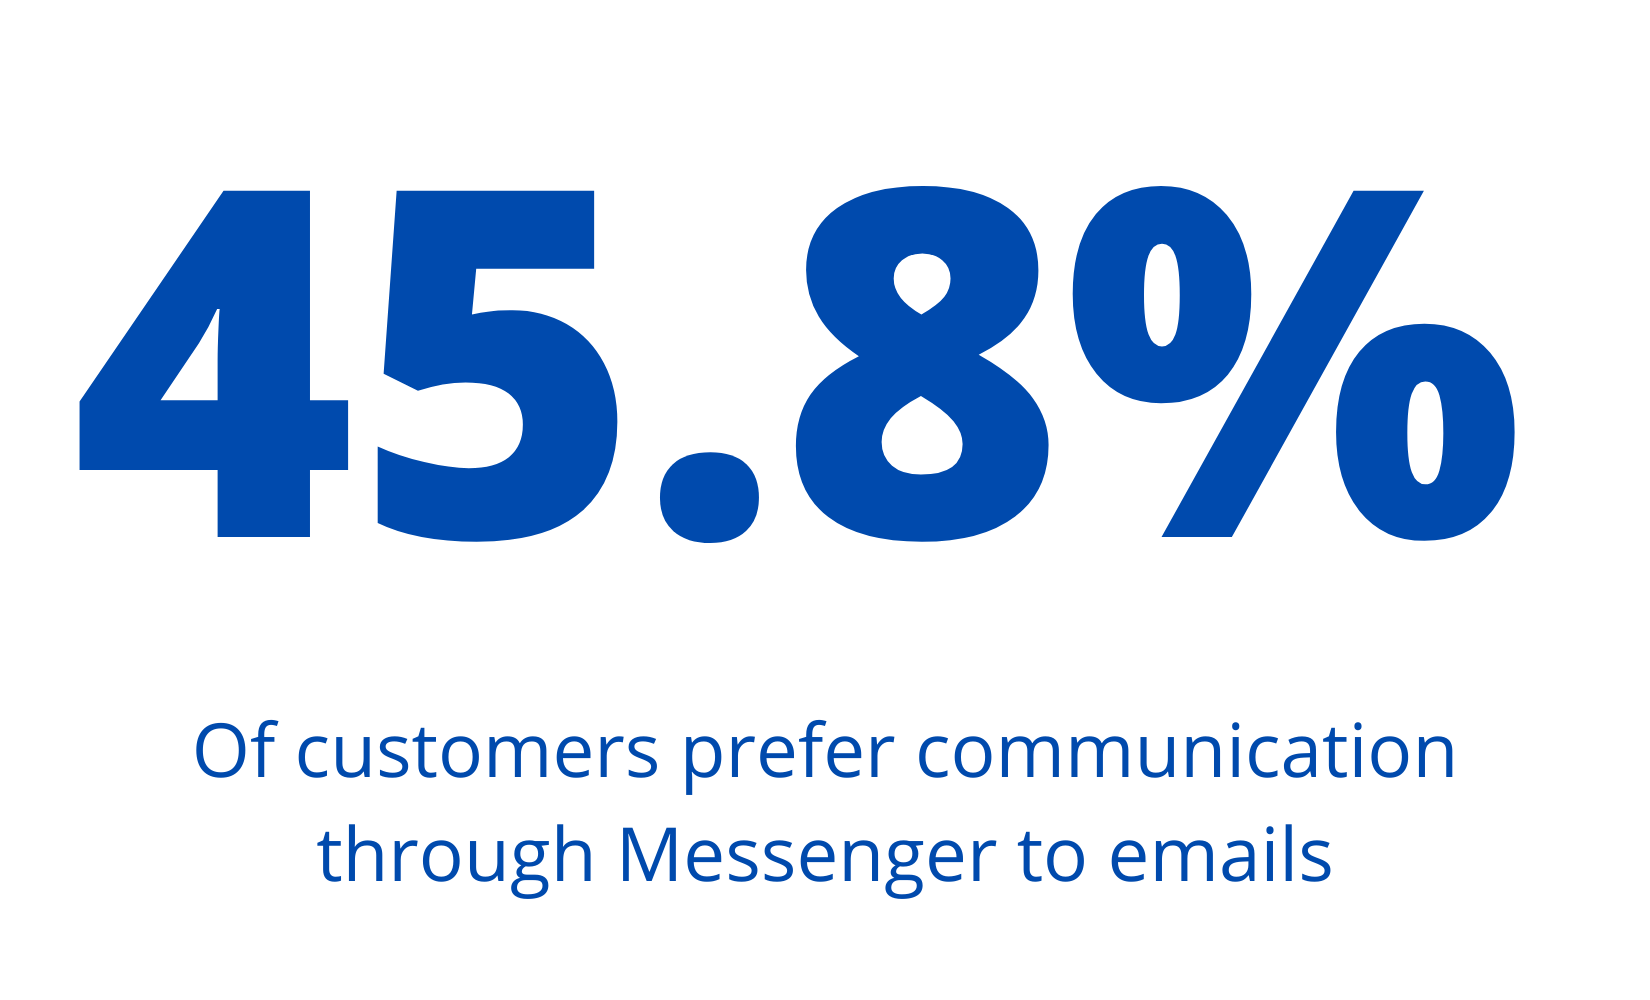
21. 45.8% of consumers prefer communicating through messaging over email


That number is excellent news if you’re already using Facebook Messenger. For example, you can use Messenger to implement chatbots as part of your marketing strategy, which can save you a massive amount of money compared to traditional customer service costs.
22. Funny, inspirational, and DIY content get the most engagement
If you scroll your Facebook feed right now, we’re willing to bet most of the content you’ll see falls within these three categories. This is because users are much more likely to share content they find useful or funny.
As such, leveraging this type of content is something to keep in mind if you want to increase engagement for your ads.
Final thoughts on Facebook marketing statistics
There’s a reason why most marketers are already on Facebook. Everyone else is on there as well, which makes it the perfect playground to try new campaigns and reach as many people as possible. Plus, Facebook is always working on new ways to help you market towards its users, such as using Stories and even 3D posts.
One of the most important Facebook marketing statistics you need to remember is that around 43% of marketers don’t know whether their efforts are paying off. Knowing how to calculate your social media Return On Investment (ROI) is critical if you want to be able to scale your efforts, and it’s a skill every marketer should possess.
What do you think the future looks like for Facebook marketing in general? Share your thoughts with us in the comments section below!
The post 22 Facebook Marketing Statistics You Need to Know in 2020 appeared first on Revive Social.